一、概述
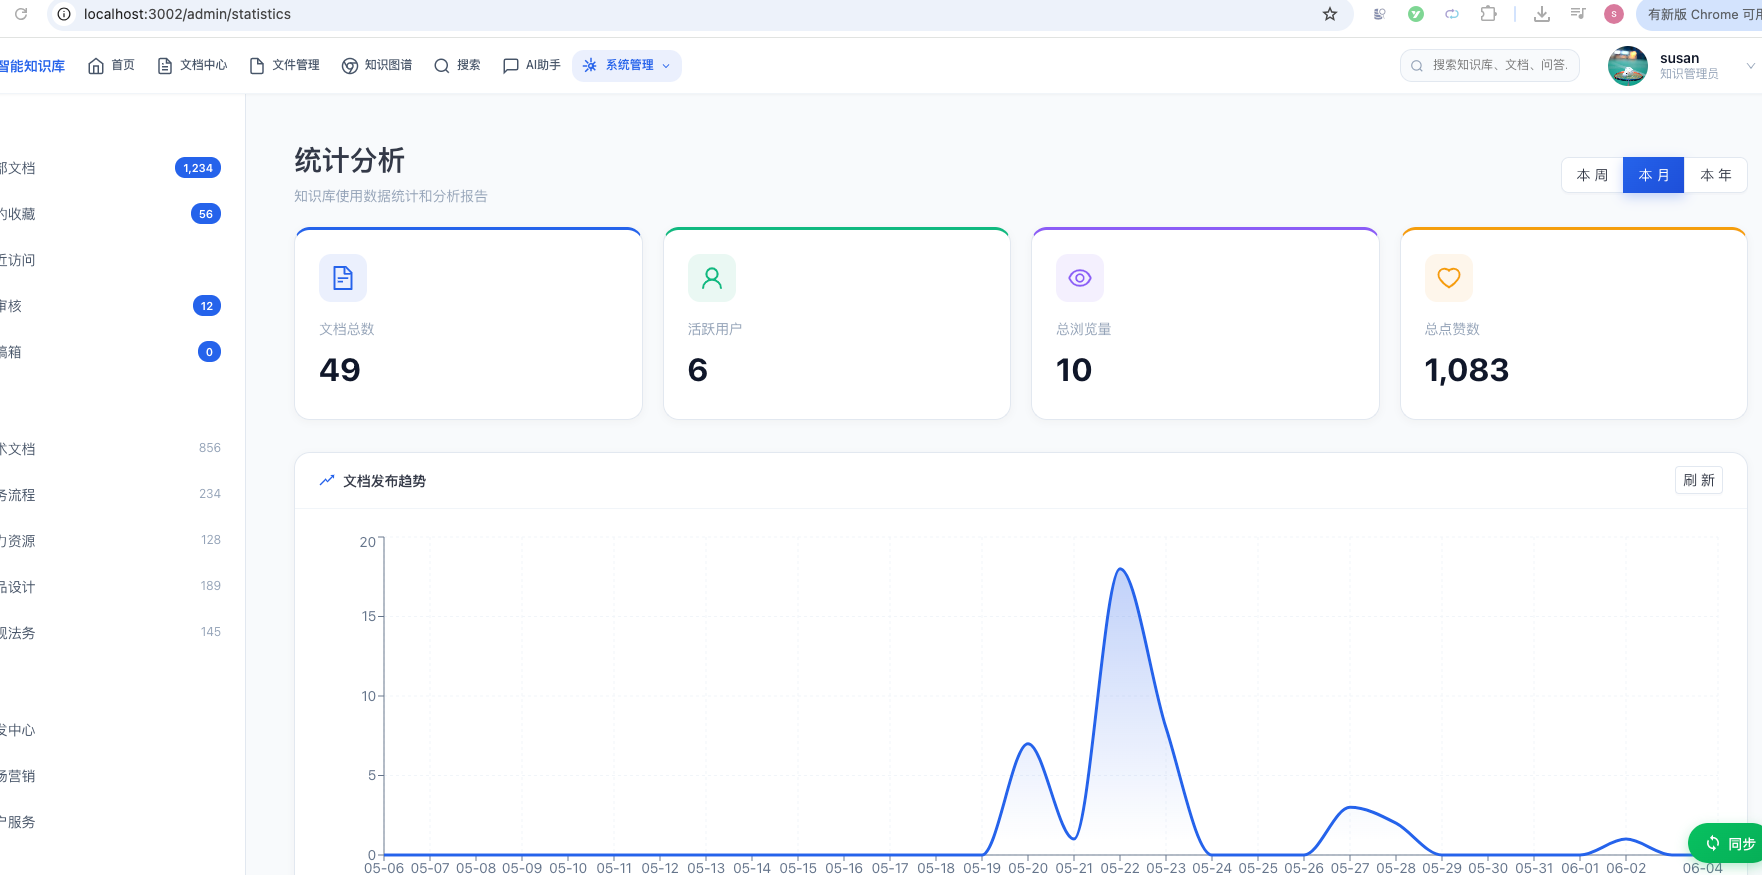
统计分析是知识库系统的数据决策中心,通过图表、排行、趋势等可视化手段展示系统运营状态。
本文将在现有统计服务的基础上,从后端到前端全面完善统计中心功能,实现日期范围筛选、趋势类型切换、数据导出、缓存管理等高级特性。
1.1 功能定位
统计中心作为系统数据分析的核心入口,提供以下功能:
| 功能模块 | 说明 | 使用场景 |
|---|---|---|
| 数据概览 | 文档数、用户数、浏览量、点赞数等核心指标 | 首页仪表盘 |
| 文档趋势 | 按日统计文档创建/浏览趋势曲线 | 运营分析 |
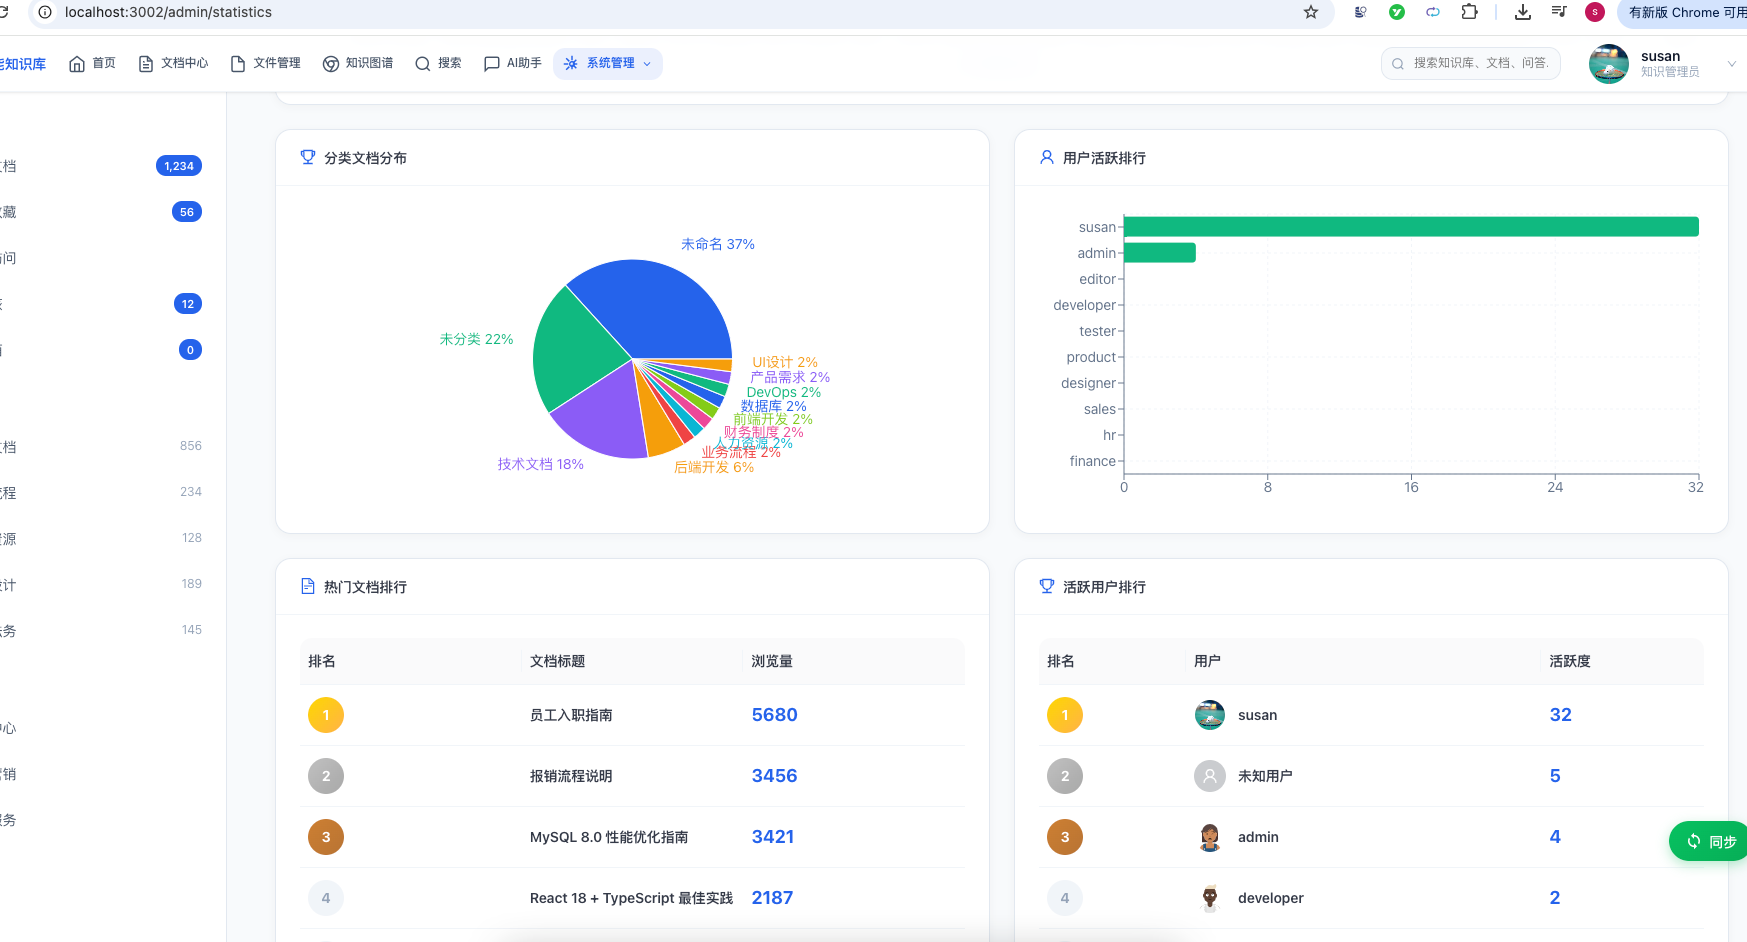
| 分类分布 | 各分类下的文档数量饼图 | 内容结构分析 |
| 用户活跃排行 | 按创建/评论/浏览维度排名用户 | 用户运营 |
| 热门文档排行 | 按浏览量/点赞量排名文档 | 内容推荐 |
| 数据导出 | 趋势数据/排行数据导出 CSV | 报告生成 |
| 缓存管理 | 手动刷新 Redis 缓存 | 运维管理 |
1.2 现状分析
当前统计中心的后端架构已经比较完善(MQ 事件采集 → view\_history 原始数据 → 定时聚合 → 预聚合表查询),但前端和 API 集成层面有些功能待完善。
1.3 架构设计

1.4 数据流说明
- 写入路径:kb-document 服务在浏览/点赞/评论操作后通过
StatisticsEventPublisher发布 MQ 事件,kb-statistics 的StatisticsMQListener消费后写入kb_view_history表和 Redis 实时计数器 - 聚合路径:
StatisticsAggregationTask每日凌晨将原始数据聚合到kb_document_statistics和kb_user_statistics预聚合表 - 查询路径:
StatisticsController→StatisticsServiceImpl→ Mapper(跨库视图/预聚合表) → Redis 缓存 → 返回 VO - 新增功能:前端新增日期范围选择器、趋势类型切换、CSV 导出,后端新增缓存管理、手动聚合触发
二、后端改造:添加高级功能端点
2.1 创建 CSV 导出服务
统计中心的趋势数据、排行数据需要支持 CSV 格式导出,方便用户下载后在 Excel 中进一步分析。
创建 kb-statistics/src/main/java/com/knowledge/base/statistics/service/StatisticsExportService.java:
package com.knowledge.base.statistics.service;

import jakarta.servlet.http.HttpServletResponse;
import java.io.IOException;
import java.time.LocalDate;

/**
 * 统计数据导出服务
 *
 * @author 苏三
 * @since 1.0.0
 */
public interface StatisticsExportService {

    /**
     * 导出文档趋势数据为 CSV
     *
     * @param startDate 开始日期
     * @param endDate   结束日期
     * @param type      趋势类型(create/view)
     * @param response  HTTP 响应
     */
    void exportDocumentTrend(LocalDate startDate, LocalDate endDate, String type,
                             HttpServletResponse response) throws IOException;

    /**
     * 导出热门文档排行 CSV
     *
     * @param type     排行类型(view/like/favorite)
     * @param size     数量
     * @param response HTTP 响应
     */
    void exportHotDocuments(String type, Integer size,
                            HttpServletResponse response) throws IOException;

    /**
     * 导出活跃用户排行 CSV
     *
     * @param type     排行类型(create/comment/view)
     * @param size     数量
     * @param response HTTP 响应
     */
    void exportActiveUsers(String type, Integer size,
                           HttpServletResponse response) throws IOException;
}
创建 kb-statistics/src/main/java/com/knowledge/base/statistics/service/impl/StatisticsExportServiceImpl.java:
package com.knowledge.base.statistics.service.impl;

import com.knowledge.base.statistics.service.StatisticsExportService;
import com.knowledge.base.statistics.service.StatisticsService;
import com.knowledge.base.statistics.vo.ActiveUserVO;
import com.knowledge.base.statistics.vo.HotDocumentVO;
import com.knowledge.base.statistics.vo.TrendVO;
import jakarta.annotation.Resource;
import jakarta.servlet.http.HttpServletResponse;
import lombok.extern.slf4j.Slf4j;
import org.springframework.stereotype.Service;

import java.io.IOException;
import java.io.OutputStreamWriter;
import java.io.PrintWriter;
import java.nio.charset.StandardCharsets;
import java.time.LocalDate;
import java.time.format.DateTimeFormatter;
import java.util.List;

/**
 * 统计数据导出服务实现
 *
 * <p>使用 CSV 格式导出统计数据,中文文件名按 RFC 5987 规范编码</p>
 *
 * @author 苏三
 * @since 1.0.0
 */
@Slf4j
@Service
public class StatisticsExportServiceImpl implements StatisticsExportService {

    private static final DateTimeFormatter DATE_FMT = DateTimeFormatter.ofPattern("yyyy-MM-dd");

    @Resource
    private StatisticsService statisticsService;

    @Override
    public void exportDocumentTrend(LocalDate startDate, LocalDate endDate, String type,
                                    HttpServletResponse response) throws IOException {
        List<TrendVO> trends = statisticsService.getDocumentTrend(startDate, endDate, type);

        String filename = "文档趋势_" + startDate.format(DATE_FMT) + "_" + endDate.format(DATE_FMT) + ".csv";
        setCsvResponseHeaders(response, filename);

        try (PrintWriter writer = new PrintWriter(
                new OutputStreamWriter(response.getOutputStream(), StandardCharsets.UTF_8))) {
            // 写入 BOM 头,确保 Excel 正确识别 UTF-8 编码
            writer.write('\uFEFF');
            // CSV 表头
            writer.println("日期,数量");
            // 数据行
            for (TrendVO trend : trends) {
                writer.println(trend.getDate() + "," + trend.getCount());
            }
        }
        log.info("文档趋势 CSV 导出完成:{} 条数据", trends.size());
    }

    @Override
    public void exportHotDocuments(String type, Integer size,
                                   HttpServletResponse response) throws IOException {
        List<HotDocumentVO> documents = statisticsService.getHotDocuments(type, size);

        String filename = "热门文档排行_" + LocalDate.now().format(DATE_FMT) + ".csv";
        setCsvResponseHeaders(response, filename);

        try (PrintWriter writer = new PrintWriter(
                new OutputStreamWriter(response.getOutputStream(), StandardCharsets.UTF_8))) {
            writer.write('\uFEFF');
            writer.println("排名,文档ID,标题,浏览量,点赞数,收藏数,评论数,统计值");
            int rank = 1;
            for (HotDocumentVO doc : documents) {
                writer.println(String.join(",",
                        String.valueOf(rank++),
                        String.valueOf(doc.getDocumentId()),
                        escapeCsvField(doc.getTitle()),
                        String.valueOf(doc.getViewCount()),
                        String.valueOf(doc.getLikeCount()),
                        String.valueOf(doc.getFavoriteCount()),
                        String.valueOf(doc.getCommentCount()),
                        String.valueOf(doc.getStatisticsValue())
                ));
            }
        }
        log.info("热门文档 CSV 导出完成:{} 条数据", documents.size());
    }

    @Override
    public void exportActiveUsers(String type, Integer size,
                                  HttpServletResponse response) throws IOException {
        List<ActiveUserVO> users = statisticsService.getActiveUsers(type, size);

        String filename = "活跃用户排行_" + LocalDate.now().format(DATE_FMT) + ".csv";
        setCsvResponseHeaders(response, filename);

        try (PrintWriter writer = new PrintWriter(
                new OutputStreamWriter(response.getOutputStream(), StandardCharsets.UTF_8))) {
            writer.write('\uFEFF');
            writer.println("排名,用户ID,用户名,真实姓名,文档数,评论数,浏览数,统计值");
            int rank = 1;
            for (ActiveUserVO user : users) {
                writer.println(String.join(",",
                        String.valueOf(rank++),
                        String.valueOf(user.getUserId()),
                        escapeCsvField(user.getUsername()),
                        escapeCsvField(user.getRealName()),
                        String.valueOf(user.getDocumentCount()),
                        String.valueOf(user.getCommentCount()),
                        String.valueOf(user.getViewCount()),
                        String.valueOf(user.getStatisticsValue())
                ));
            }
        }
        log.info("活跃用户 CSV 导出完成:{} 条数据", users.size());
    }

    /**
     * 设置 CSV 下载响应头
     */
    private void setCsvResponseHeaders(HttpServletResponse response, String filename) {
        response.setContentType("text/csv;charset=UTF-8");
        response.setCharacterEncoding("UTF-8");
        // RFC 5987 编码文件名,支持中文
        String encodedFilename = java.net.URLEncoder.encode(filename, StandardCharsets.UTF_8)
                .replace("+", "%20");
        response.setHeader("Content-Disposition",
                "attachment; filename*=UTF-8''" + encodedFilename);
    }

    /**
     * 转义 CSV 字段中的特殊字符(逗号、双引号、换行)
     */
    private String escapeCsvField(String field) {
        if (field == null) return "";
        if (field.contains(",") || field.contains("\"") || field.contains("\n")) {
            return "\"" + field.replace("\"", "\"\"") + "\"";
        }
        return field;
    }
}
2.2 新增 Controller 端点
在 StatisticsController.java 中新增以下端点:
// ==================== 新增方法 ====================

@Resource
private StatisticsExportService statisticsExportService;

/**
 * 清除所有统计缓存
 */
@DeleteMapping("/cache")
@Operation(summary = "清除缓存", description = "清除所有统计数据的 Redis 缓存")
public Result<String> clearCache() {
    log.info("清除统计缓存请求");
    // 调用 Service 层方法清除缓存(需要在 StatisticsServiceImpl 中实现)
    statisticsService.clearAllCache();
    return Result.success("统计缓存已清除");
}

/**
 * 手动触发文档统计聚合
 */
@PostMapping("/aggregation/document")
@Operation(summary = "手动触发文档聚合", description = "手动触发文档统计日聚合任务")
public Result<String> triggerDocumentAggregation() {
    log.info("手动触发文档统计聚合请求");
    statisticsService.triggerDocumentAggregation();
    return Result.success("文档统计聚合已触发");
}

/**
 * 手动触发用户统计聚合
 */
@PostMapping("/aggregation/user")
@Operation(summary = "手动触发用户聚合", description = "手动触发用户统计日聚合任务")
public Result<String> triggerUserAggregation() {
    log.info("手动触发用户统计聚合请求");
    statisticsService.triggerUserAggregation();
    return Result.success("用户统计聚合已触发");
}

/**
 * 导出文档趋势 CSV
 */
@GetMapping("/export/trend")
@Operation(summary = "导出文档趋势CSV", description = "导出文档趋势数据为CSV文件")
public void exportDocumentTrend(
        @Parameter(description = "开始日期", required = true) @RequestParam LocalDate startDate,
        @Parameter(description = "结束日期", required = true) @RequestParam LocalDate endDate,
        @Parameter(description = "趋势类型", required = true) @RequestParam String type,
        HttpServletResponse response) throws IOException {
    log.info("导出文档趋势 CSV:startDate={}, endDate={}, type={}", startDate, endDate, type);
    statisticsExportService.exportDocumentTrend(startDate, endDate, type, response);
}

/**
 * 导出热门文档排行 CSV
 */
@GetMapping("/export/hot-documents")
@Operation(summary = "导出热门文档CSV", description = "导出热门文档排行数据为CSV文件")
public void exportHotDocuments(
        @Parameter(description = "排行类型") @RequestParam(defaultValue = "view") String type,
        @Parameter(description = "数量") @RequestParam(defaultValue = "20") Integer size,
        HttpServletResponse response) throws IOException {
    log.info("导出热门文档排行 CSV:type={}, size={}", type, size);
    statisticsExportService.exportHotDocuments(type, size, response);
}

/**
 * 导出活跃用户排行 CSV
 */
@GetMapping("/export/active-users")
@Operation(summary = "导出活跃用户CSV", description = "导出活跃用户排行数据为CSV文件")
public void exportActiveUsers(
        @Parameter(description = "排行类型") @RequestParam(defaultValue = "create") String type,
        @Parameter(description = "数量") @RequestParam(defaultValue = "20") Integer size,
        HttpServletResponse response) throws IOException {
    log.info("导出活跃用户排行 CSV:type={}, size={}", type, size);
    statisticsExportService.exportActiveUsers(type, size, response);
}
2.3 完善 StatisticsService 接口
在 StatisticsService.java 中新增以下方法:
// 在 StatisticsService 接口中新增以下方法

/**
 * 清除所有统计缓存
 */
void clearAllCache();

/**
 * 手动触发文档统计日聚合
 */
void triggerDocumentAggregation();

/**
 * 手动触发用户统计日聚合
 */
void triggerUserAggregation();
2.4 完善 StatisticsServiceImpl
在 StatisticsServiceImpl.java 中新增以下实现:
// 注意在类顶部添加 import:
// import org.springframework.cache.CacheManager;
// import org.springframework.cache.Cache;

@Resource
private CacheManager cacheManager;

@Resource
private StatisticsAggregationTask aggregationTask;

@Override
public void clearAllCache() {
    log.info("清除所有统计缓存");
    clearCache(CACHE_OVERVIEW);
    clearCache(CACHE_ADMIN_OVERVIEW);
    clearCache(CACHE_DASHBOARD);
    clearCache(CACHE_CATEGORY_DIST);
    clearCache(CACHE_HOT_DOCS);
    clearCache(CACHE_ACTIVE_USERS);
    clearCache(CACHE_DOC_TREND);
    clearCache(CACHE_USER_ACTIVITY);
}

private void clearCache(String cacheName) {
    Cache cache = cacheManager.getCache(cacheName);
    if (cache != null) {
        cache.clear();
        log.debug("已清除缓存:{}", cacheName);
    }
}

@Override
public void triggerDocumentAggregation() {
    log.info("手动触发文档统计日聚合");
    try {
        aggregationTask.aggregateDailyDocumentStatistics();
    } catch (Exception e) {
        log.error("手动触发文档统计聚合失败:{}", e.getMessage(), e);
        throw new BusinessException("文档统计聚合失败:" + e.getMessage());
    }
}

@Override
public void triggerUserAggregation() {
    log.info("手动触发用户统计日聚合");
    try {
        aggregationTask.aggregateDailyUserStatistics();
    } catch (Exception e) {
        log.error("手动触发用户统计聚合失败:{}", e.getMessage(), e);
        throw new BusinessException("用户统计聚合失败:" + e.getMessage());
    }
}
2.5 设计思路
- CSV 导出使用流式写入:通过
HttpServletResponse.getOutputStream()直接写入响应流,不产生中间文件,避免磁盘 I/O 和大文件内存占用 - BOM 头:CSV 文件开头写入
\uFEFF,确保 Microsoft Excel 能正确识别 UTF-8 编码 - RFC 5987 文件名编码:
filename*=UTF-8''xxx格式,解决中文文件名在各浏览器中的兼容问题 - CSV 字段转义:当字段包含逗号、双引号或换行时,用双引号包围并将内部双引号替换为两个双引号
- 缓存清除:通过
CacheManager按名称清除对应缓存,支持手动刷新数据 - 手动聚合:直接调用
StatisticsAggregationTask的 public 方法,方便运维在非凌晨时段触发聚合
三、前端改造:Typescript 类型定义
3.1 更新 types/index.ts
当前 types/index.ts 中的统计类型与后端 VO 不匹配,需要新增精确的类型定义:
// ==================== 新增统计类型定义 ====================

/**
 * 数据概览响应(对应后端 OverviewVO)
 */
export interface StatisticsOverview {
  totalDocuments: number;
  totalUsers: number;
  todayDocuments: number;
  todayUsers: number;
  totalViews: number;
  todayViews: number;
  totalLikes: number;
  totalFavorites: number;
  totalComments: number;
  pendingReviews: number;
  aiSearchCount: number;
  aiQaCount: number;
  activeUserCount: number;
}

/**
 * 趋势数据点(对应后端 TrendVO)
 */
export interface TrendDataPoint {
  date: string;
  count: number;
}

/**
 * 用户活动数据(对应后端 UserActivityVO)
 */
export interface UserActivityItem {
  userId: number;
  username: string;
  documentCount: number;
  commentCount: number;
  viewCount: number;
  activityScore: number;
}

/**
 * 分类分布(对应后端 CategoryDistributionVO)
 */
export interface CategoryDistributionItem {
  categoryId: number;
  categoryName: string;
  documentCount: number;
  percentage: number;
}

/**
 * 热门文档(对应后端 HotDocumentVO)
 */
export interface HotDocumentItem {
  documentId: number;
  title: string;
  authorId: number;
  authorName: string;
  categoryId: number;
  categoryName: string;
  viewCount: number;
  likeCount: number;
  favoriteCount: number;
  commentCount: number;
  statisticsValue: number;
}

/**
 * 活跃用户(对应后端 ActiveUserVO)
 */
export interface ActiveUserItem {
  userId: number;
  username: string;
  realName: string;
  avatar: string;
  documentCount: number;
  commentCount: number;
  viewCount: number;
  statisticsValue: number;
}

/**
 * 仪表盘综合数据(对应后端 DashboardVO)
 */
export interface DashboardData {
  overview: StatisticsOverview;
  documentTrend: TrendDataPoint[];
  categoryDistribution: CategoryDistributionItem[];
  hotDocuments: HotDocumentItem[];
  activeUsers: ActiveUserItem[];
}

/**
 * 统计查询参数
 */
export interface StatisticsQueryParams {
  startDate?: string;
  endDate?: string;
  trendType?: 'create' | 'view' | 'like' | 'favorite';
  rankType?: 'view' | 'like' | 'favorite';
  userRankType?: 'create' | 'comment' | 'view';
  limit?: number;
}
3.2 设计说明
- 类型精确匹配:新类型字段名与后端 VO 完全一致,确保
http.get<T>()的泛型约束有效 TrendType** 联合类型**:约束趋势类型只能是后端支持的create/viewStatisticsQueryParams:统一管理所有统计 API 的查询参数,避免在 service 方法中分散定义
四、前端改造:重构 statistics.service.ts
4.1 完整替换 statistics.service.ts
import dayjs from 'dayjs';
import { http } from './request';
import {
  StatisticsOverview,
  DashboardData,
  TrendDataPoint,
  UserActivityItem,
  CategoryDistributionItem,
  HotDocumentItem,
  ActiveUserItem,
  StatisticsQueryParams,
} from '@/types';

/**
 * 统计服务
 *
 * <p>职责说明:</p>
 * <ul>
 *   <li>系统统计概览</li>
 *   <li>文档趋势与用户活跃度</li>
 *   <li>热门文档与活跃用户排行</li>
 *   <li>分类分布</li>
 *   <li>数据导出(CSV)</li>
 *   <li>缓存管理</li>
 * </ul>
 *
 * @author 苏三
 * @since 1.0.0
 */
export const statisticsService = {
  // ==================== 数据查询 ====================

  /**
   * 获取数据概览
   */
  getOverview: (params?: { startDate?: string; endDate?: string }): Promise<StatisticsOverview> => {
    return http.get<StatisticsOverview>('/statistics/overview', { params });
  },

  /**
   * 获取仪表盘综合数据
   */
  getDashboard: (): Promise<DashboardData> => {
    return http.get<DashboardData>('/statistics/dashboard');
  },

  /**
   * 获取管理后台概览
   */
  getAdminOverview: (): Promise<StatisticsOverview> => {
    return http.get<StatisticsOverview>('/statistics/admin-overview');
  },

  /**
   * 获取文档趋势
   *
   * @param params 包含 startDate、endDate、trendType
   */
  getDocumentTrend: (params: {
    startDate: string;
    endDate: string;
    trendType?: 'create' | 'view';
  }): Promise<TrendDataPoint[]> => {
    return http.get<TrendDataPoint[]>('/statistics/trend/document', {
      params: {
        startDate: params.startDate,
        endDate: params.endDate,
        type: params.trendType || 'create',
      },
    });
  },

  /**
   * 获取用户活跃度数据
   */
  getUserActivity: (params: {
    startDate: string;
    endDate: string;
  }): Promise<UserActivityItem[]> => {
    return http.get<UserActivityItem[]>('/statistics/activity/user', {
      params: { startDate: params.startDate, endDate: params.endDate },
    });
  },

  /**
   * 获取分类分布
   */
  getCategoryDistribution: (): Promise<CategoryDistributionItem[]> => {
    return http.get<CategoryDistributionItem[]>('/statistics/distribution/category');
  },

  /**
   * 获取热门文档排行
   */
  getHotDocuments: (params: {
    type?: 'view' | 'like' | 'favorite';
    size?: number;
  }): Promise<HotDocumentItem[]> => {
    return http.get<HotDocumentItem[]>('/statistics/hot/document', {
      params: { type: params.type || 'view', size: params.size || 10 },
    });
  },

  /**
   * 获取活跃用户排行
   */
  getActiveUsers: (params: {
    type?: 'create' | 'comment' | 'view';
    size?: number;
  }): Promise<ActiveUserItem[]> => {
    return http.get<ActiveUserItem[]>('/statistics/active/user', {
      params: { type: params.type || 'create', size: params.size || 10 },
    });
  },

  // ==================== 数据导出 ====================

  /**
   * 导出文档趋势 CSV
   */
  exportTrendCSV: (params: {
    startDate: string;
    endDate: string;
    type?: 'create' | 'view';
  }): Promise<void> => {
    return http.download(
      `/statistics/export/trend?startDate=${params.startDate}&endDate=${params.endDate}&type=${params.type || 'create'}`
    );
  },

  /**
   * 导出热门文档排行 CSV
   */
  exportHotDocumentsCSV: (params: {
    type?: 'view' | 'like' | 'favorite';
    size?: number;
  }): Promise<void> => {
    return http.download(
      `/statistics/export/hot-documents?type=${params.type || 'view'}&size=${params.size || 20}`
    );
  },

  /**
   * 导出活跃用户排行 CSV
   */
  exportActiveUsersCSV: (params: {
    type?: 'create' | 'comment' | 'view';
    size?: number;
  }): Promise<void> => {
    return http.download(
      `/statistics/export/active-users?type=${params.type || 'create'}&size=${params.size || 20}`
    );
  },

  // ==================== 缓存管理 ====================

  /**
   * 手动清除所有统计缓存
   */
  clearCache: (): Promise<string> => {
    return http.delete<string>('/statistics/cache');
  },

  /**
   * 手动触发文档统计聚合
   */
  triggerDocumentAggregation: (): Promise<string> => {
    return http.post<string>('/statistics/aggregation/document');
  },

  /**
   * 手动触发用户统计聚合
   */
  triggerUserAggregation: (): Promise<string> => {
    return http.post<string>('/statistics/aggregation/user');
  },
};

/**
 * 便捷函数:根据周期计算日期范围
 */
export const getDateRange = (period: 'week' | 'month' | 'year'): { startDate: string; endDate: string } => {
  const endDate = dayjs().format('YYYY-MM-DD');
  const dayMap: Record<string, number> = { week: 6, month: 29, year: 364 };
  const startDate = dayjs().subtract(dayMap[period], 'days').format('YYYY-MM-DD');
  return { startDate, endDate };
};

export default statisticsService;
4.3 设计说明
- 移除重复代码:
getDateRange统一从此模块导出,前端页面不再重复定义 - 精确的泛型类型:每个方法都有明确的返回值类型,编译期即可发现字段不匹配
- **导出方法使用 **
http.download:复用已有的下载工具函数,自动处理 Content-Disposition 文件名解析 - 便捷函数导出:
getDateRange作为命名导出,方便多个页面复用
五、前端改造:重构 StatisticsPage.tsx
5.1 完整替换 StatisticsPage.tsx
import React, { useEffect, useState, useCallback } from 'react';
import {
Card,
Row,
Col,
Statistic,
Button,
Spin,
Table,
Avatar,
Space,
Typography,
DatePicker,
Select,
Segmented,
Tooltip,
Badge,
Alert,
Empty,
} from 'antd';
import { App } from 'antd';
import {
FileTextOutlined,
UserOutlined,
EyeOutlined,
HeartOutlined,
TrophyOutlined,
RiseOutlined,
DownloadOutlined,
ReloadOutlined,
ClearOutlined,
BarChartOutlined,
LineChartOutlined,
PieChartOutlined,
} from '@ant-design/icons';
import { statisticsService, getDateRange } from '@/services/statistics.service';
import dayjs from 'dayjs';
import type { Dayjs } from 'dayjs';
import {
AreaChart,
Area,
BarChart,
Bar,
PieChart,
Pie,
Cell,
XAxis,
YAxis,
CartesianGrid,
Tooltip as RechartsTooltip,
ResponsiveContainer,
Legend,
} from 'recharts';
import type {
StatisticsOverview,
TrendDataPoint,
UserActivityItem,
CategoryDistributionItem,
HotDocumentItem,
ActiveUserItem,
} from '@/types';
const { Title, Text } = Typography;
const { RangePicker } = DatePicker;
const CHART_COLORS = [
'#2563eb', '#10b981', '#8b5cf6', '#f59e0b', '#ef4444',
'#06b6d4', '#ec4899', '#84cc16',
];
// ==================== 组件 ====================
export const StatisticsPage: React.FC = () => {
const { message } = App.useApp();
// 加载状态
const [loading, setLoading] = useState(true);
const [error, setError] = useState<string | null>(null);
const [exporting, setExporting] = useState<string | null>(null);
// 数据状态
const [overview, setOverview] = useState<StatisticsOverview | null>(null);
const [documentTrend, setDocumentTrend] = useState<TrendDataPoint[]>([]);
const [userActivity, setUserActivity] = useState<UserActivityItem[]>([]);
const [categoryDistribution, setCategoryDistribution] = useState<CategoryDistributionItem[]>([]);
const [popularDocuments, setPopularDocuments] = useState<HotDocumentItem[]>([]);
const [activeUsers, setActiveUsers] = useState<ActiveUserItem[]>([]);
// 筛选状态
const [dateRange, setDateRange] = useState<[Dayjs, Dayjs]>([
dayjs().subtract(29, 'days'),
dayjs(),
]);
const [trendType, setTrendType] = useState<'create' | 'view'>('create');
const [hotDocType, setHotDocType] = useState<'view' | 'like' | 'favorite'>('view');
const [activeUserType, setActiveUserType] = useState<'create' | 'comment' | 'view'>('create');
const [presetPeriod, setPresetPeriod] = useState<'month' | 'week' | 'year'>('month');
// 自动刷新
const [autoRefresh, setAutoRefresh] = useState(false);
// ==================== 数据加载 ====================
const fetchAllData = useCallback(async () => {
setLoading(true);
setError(null);
try {
const startDate = dateRange[0].format('YYYY-MM-DD');
const endDate = dateRange[1].format('YYYY-MM-DD');
const [
overviewRes,
trendRes,
activityRes,
categoryRes,
docsRes,
usersRes,
] = await Promise.all([
statisticsService.getOverview({ startDate, endDate }),
statisticsService.getDocumentTrend({ startDate, endDate, trendType }),
statisticsService.getUserActivity({ startDate, endDate }),
statisticsService.getCategoryDistribution(),
statisticsService.getHotDocuments({ type: hotDocType, size: 10 }),
statisticsService.getActiveUsers({ type: activeUserType, size: 10 }),
]);
setOverview(overviewRes);
setDocumentTrend(trendRes || []);
setUserActivity(activityRes || []);
setCategoryDistribution(categoryRes || []);
setPopularDocuments(docsRes || []);
setActiveUsers(usersRes || []);
} catch (err: any) {
const msg = err?.message || '加载统计数据失败';
setError(msg);
console.error('统计数据加载失败:', err);
} finally {
setLoading(false);
}
}, [dateRange, trendType, hotDocType, activeUserType]);
useEffect(() => {
fetchAllData();
}, [fetchAllData]);
// 自动刷新
useEffect(() => {
if (!autoRefresh) return;
const timer = setInterval(fetchAllData, 60_000); // 每分钟刷新
return () => clearInterval(timer);
}, [autoRefresh, fetchAllData]);
// ==================== 事件处理 ====================
/** 预设周期切换 */
const handlePresetChange = (period: 'week' | 'month' | 'year') => {
setPresetPeriod(period);
const { startDate, endDate } = getDateRange(period);
setDateRange([dayjs(startDate), dayjs(endDate)]);
};
/** 日期范围变更 */
const handleDateChange = (dates: [Dayjs | null, Dayjs | null] | null) => {
if (dates && dates[0] && dates[1]) {
setDateRange([dates[0], dates[1]]);
setPresetPeriod('month'); // 自定义日期时重置预设
}
};
/** 导出趋势 CSV */
const handleExportTrend = async () => {
setExporting('trend');
try {
await statisticsService.exportTrendCSV({
startDate: dateRange[0].format('YYYY-MM-DD'),
endDate: dateRange[1].format('YYYY-MM-DD'),
type: trendType,
});
message.success('趋势数据导出成功');
} catch {
message.error('导出失败');
} finally {
setExporting(null);
}
};
/** 导出热门文档 CSV */
const handleExportHotDocs = async () => {
setExporting('docs');
try {
await statisticsService.exportHotDocumentsCSV({ type: hotDocType, size: 50 });
message.success('热门文档导出成功');
} catch {
message.error('导出失败');
} finally {
setExporting(null);
}
};
/** 导出活跃用户 CSV */
const handleExportActiveUsers = async () => {
setExporting('users');
try {
await statisticsService.exportActiveUsersCSV({ type: activeUserType, size: 50 });
message.success('活跃用户导出成功');
} catch {
message.error('导出失败');
} finally {
setExporting(null);
}
};
/** 清除缓存并刷新 */
const handleClearCache = async () => {
try {
await statisticsService.clearCache();
message.success('缓存已清除,正在重新加载数据...');
fetchAllData();
} catch {
message.error('清除缓存失败');
}
};
// ==================== 数据格式化 ====================
const formatTrendData = (data: TrendDataPoint[]) =>
data.map((item) => ({
date: item.date ? dayjs(item.date).format('MM-DD') : item.date,
count: Number(item.count) || 0,
}));
const formatCategoryData = (data: CategoryDistributionItem[]) =>
data.map((item, index) => ({
name: item.categoryName || `分类${item.categoryId || index}`,
value: Number(item.documentCount) || 0,
color: CHART_COLORS[index % CHART_COLORS.length],
}));
const formatActivityData = (data: UserActivityItem[]) =>
data.slice(0, 10).map((item) => ({
name: item.username || `用户${item.userId}`,
score: Math.round(Number(item.activityScore) || 0),
}));
const safeNum = (val: any): number => Number(val) || 0;
// ==================== 表格列定义 ====================
const rankRender = (_: any, __: any, index: number) => {
let rankBg = '#f1f5f9';
let rankColor = '#94a3b8';
if (index === 0) { rankColor = '#fff'; rankBg = 'linear-gradient(135deg, #ffd700, #ffb347)'; }
else if (index === 1) { rankColor = '#fff'; rankBg = 'linear-gradient(135deg, #c0c0c0, #a8a8a8)'; }
else if (index === 2) { rankColor = '#fff'; rankBg = 'linear-gradient(135deg, #cd7f32, #b87333)'; }
return (
<div style={{
width: 36, height: 36, borderRadius: '50%', background: rankBg,
display: 'flex', alignItems: 'center', justifyContent: 'center',
fontWeight: 700, color: rankColor, fontSize: 14,
}}>
{index + 1}
</div>
);
};
const docColumns = [
{ title: '排名', key: 'rank', render: rankRender },
{
title: '文档标题', dataIndex: 'title', key: 'title', ellipsis: true,
render: (text: string) => <Text strong>{text || '未知文档'}</Text>,
},
{
title: '浏览量', dataIndex: 'viewCount', key: 'viewCount',
render: (views: number) => (
<Text style={{ fontSize: 18, fontWeight: 700, color: '#2563eb' }}>
{(views ?? 0).toLocaleString()}
</Text>
),
},
];
const userColumns = [
{ title: '排名', key: 'rank', render: rankRender },
{
title: '用户', dataIndex: 'username', key: 'username',
render: (name: string, record: ActiveUserItem) => (
<div style={{ display: 'flex', alignItems: 'center', gap: 12 }}>
<Avatar size={32} icon={<UserOutlined />} src={record.avatar} />
<div>
<div><Text strong>{name || '未知用户'}</Text></div>
{record.realName && (
<div><Text type="secondary" style={{ fontSize: 12 }}>{record.realName}</Text></div>
)}
</div>
</div>
),
},
{
title: '贡献度', dataIndex: 'statisticsValue', key: 'statisticsValue',
render: (value: number) => (
<Text style={{ fontSize: 18, fontWeight: 700, color: '#2563eb' }}>
{value ?? 0}
</Text>
),
},
];
// ==================== 加载/错误状态 ====================
if (loading && !overview) {
return (
<div style={{ padding: '16px 16px 32px 16px', background: '#f8fafc', minHeight: '100vh' }}>
<div style={{ textAlign: 'center', padding: '100px 0' }}>
<Spin size="large" tip="加载统计数据中..." />
</div>
</div>
);
}
// ==================== 渲染 ====================
return (
<div style={{ padding: '16px 16px 32px 16px', background: '#f8fafc', minHeight: '100vh' }}>
{/* 页面头部 */}
<div style={{ marginBottom: 20 }}>
<div style={{ display: 'flex', justifyContent: 'space-between', alignItems: 'flex-start', flexWrap: 'wrap', gap: 12 }}>
<div>
<Title level={2} style={{ margin: 0, marginBottom: 8, fontSize: 28, fontWeight: 700 }}>
统计分析
</Title>
<Text type="secondary">知识库使用数据统计和分析报告</Text>
</div>
<Space wrap>
{/* 自动刷新 */}
<Tooltip title={autoRefresh ? '关闭自动刷新' : '开启每分钟自动刷新'}>
<Button
type={autoRefresh ? 'primary' : 'default'}
icon={<ReloadOutlined spin={autoRefresh} />}
onClick={() => setAutoRefresh(!autoRefresh)}
size="small"
>
{autoRefresh ? '自动刷新中' : '自动刷新'}
</Button>
</Tooltip>
{/* 清除缓存 */}
<Tooltip title="清除 Redis 缓存并重新加载数据">
<Button icon={<ClearOutlined />} onClick={handleClearCache} size="small">
清除缓存
</Button>
</Tooltip>
{/* 手动刷新 */}
<Button type="primary" icon={<ReloadOutlined />} onClick={fetchAllData} loading={loading}>
刷新数据
</Button>
</Space>
</div>
{/* 错误提示 */}
{error && (
<Alert
message="数据加载失败"
description={error}
type="warning"
showIcon
closable
onClose={() => setError(null)}
style={{ marginTop: 12 }}
action={
<Button size="small" onClick={fetchAllData}>重试</Button>
}
/>
)}
</div>
{/* 筛选栏 */}
<Card
size="small"
style={{ marginBottom: 20, borderRadius: 12, border: '1px solid #e2e8f0' }}
>
<Row gutter={[16, 12]} align="middle">
<Col>
<Space>
<Text strong>时间范围:</Text>
<Segmented
value={presetPeriod}
onChange={(val) => handlePresetChange(val as 'week' | 'month' | 'year')}
options={[
{ label: '本周', value: 'week' },
{ label: '本月', value: 'month' },
{ label: '本年', value: 'year' },
]}
/>
<RangePicker
value={dateRange}
onChange={(dates) => handleDateChange(dates as [Dayjs | null, Dayjs | null] | null)}
allowClear={false}
style={{ width: 260 }}
/>
</Space>
</Col>
<Col>
<Space>
<Text strong>趋势类型:</Text>
<Segmented
value={trendType}
onChange={(val) => setTrendType(val as 'create' | 'view')}
options={[
{ label: '新增文档', value: 'create', icon: <FileTextOutlined /> },
{ label: '浏览趋势', value: 'view', icon: <EyeOutlined /> },
]}
/>
</Space>
</Col>
<Col>
<Space>
<Text strong>排行维度:</Text>
<Select
value={hotDocType}
onChange={setHotDocType}
style={{ width: 100 }}
options={[
{ label: '浏览量', value: 'view' },
{ label: '点赞数', value: 'like' },
{ label: '收藏数', value: 'favorite' },
]}
/>
<Select
value={activeUserType}
onChange={setActiveUserType}
style={{ width: 100 }}
options={[
{ label: '创建数', value: 'create' },
{ label: '评论数', value: 'comment' },
{ label: '浏览数', value: 'view' },
]}
/>
</Space>
</Col>
</Row>
</Card>
{/* 统计卡片 */}
<Row gutter={20} style={{ marginBottom: 32 }}>
<Col xs={24} sm={12} lg={6}>
<Card
style={{
borderRadius: 16, border: '1px solid #e2e8f0',
boxShadow: '0 2px 8px rgba(0, 0, 0, 0.04)', borderTop: '3px solid #2563eb',
}}
>
<div style={{
width: 48, height: 48, borderRadius: 12,
background: 'rgba(37, 99, 235, 0.1)',
display: 'flex', alignItems: 'center', justifyContent: 'center', marginBottom: 16,
}}>
<FileTextOutlined style={{ fontSize: 24, color: '#2563eb' }} />
</div>
<Statistic
title="文档总数"
value={safeNum(overview?.totalDocuments)}
valueStyle={{ fontSize: 32, fontWeight: 700, color: '#0f172a' }}
loading={loading}
/>
</Card>
</Col>
<Col xs={24} sm={12} lg={6}>
<Card
style={{
borderRadius: 16, border: '1px solid #e2e8f0',
boxShadow: '0 2px 8px rgba(0, 0, 0, 0.04)', borderTop: '3px solid #10b981',
}}
>
<div style={{
width: 48, height: 48, borderRadius: 12,
background: 'rgba(16, 185, 129, 0.1)',
display: 'flex', alignItems: 'center', justifyContent: 'center', marginBottom: 16,
}}>
<UserOutlined style={{ fontSize: 24, color: '#10b981' }} />
</div>
<Statistic
title="活跃用户"
value={safeNum(overview?.activeUserCount || overview?.totalUsers)}
valueStyle={{ fontSize: 32, fontWeight: 700, color: '#0f172a' }}
loading={loading}
/>
</Card>
</Col>
<Col xs={24} sm={12} lg={6}>
<Card
style={{
borderRadius: 16, border: '1px solid #e2e8f0',
boxShadow: '0 2px 8px rgba(0, 0, 0, 0.04)', borderTop: '3px solid #8b5cf6',
}}
>
<div style={{
width: 48, height: 48, borderRadius: 12,
background: 'rgba(139, 92, 246, 0.1)',
display: 'flex', alignItems: 'center', justifyContent: 'center', marginBottom: 16,
}}>
<EyeOutlined style={{ fontSize: 24, color: '#8b5cf6' }} />
</div>
<Statistic
title="总浏览量"
value={safeNum(overview?.totalViews)}
valueStyle={{ fontSize: 32, fontWeight: 700, color: '#0f172a' }}
loading={loading}
/>
</Card>
</Col>
<Col xs={24} sm={12} lg={6}>
<Card
style={{
borderRadius: 16, border: '1px solid #e2e8f0',
boxShadow: '0 2px 8px rgba(0, 0, 0, 0.04)', borderTop: '3px solid #f59e0b',
}}
>
<div style={{
width: 48, height: 48, borderRadius: 12,
background: 'rgba(245, 158, 11, 0.1)',
display: 'flex', alignItems: 'center', justifyContent: 'center', marginBottom: 16,
}}>
<HeartOutlined style={{ fontSize: 24, color: '#f59e0b' }} />
</div>
<Statistic
title="总点赞数"
value={safeNum(overview?.totalLikes)}
valueStyle={{ fontSize: 32, fontWeight: 700, color: '#0f172a' }}
loading={loading}
/>
</Card>
</Col>
</Row>
{/* 文档趋势图 */}
<Row gutter={24} style={{ marginBottom: 24 }}>
<Col span={24}>
<Card
title={
<Space>
{trendType === 'create' ? (
<RiseOutlined style={{ color: '#2563eb' }} />
) : (
<LineChartOutlined style={{ color: '#2563eb' }} />
)}
<Text strong>
{trendType === 'create' ? '文档发布趋势' : '文档浏览趋势'}
</Text>
</Space>
}
extra={
<Space>
<Tooltip title="导出趋势数据 CSV">
<Button
size="small"
icon={<DownloadOutlined />}
onClick={handleExportTrend}
loading={exporting === 'trend'}
>
导出CSV
</Button>
</Tooltip>
<Button size="small" onClick={fetchAllData} icon={<ReloadOutlined />}>
刷新
</Button>
</Space>
}
style={{
borderRadius: 12, border: '1px solid #e2e8f0',
boxShadow: '0 2px 8px rgba(0, 0, 0, 0.04)',
}}
>
{documentTrend.length > 0 ? (
<ResponsiveContainer width="100%" height={380}>
<AreaChart data={formatTrendData(documentTrend)}>
<defs>
<linearGradient id="colorCount" x1="0" y1="0" x2="0" y2="1">
<stop offset="5%" stopColor="#2563eb" stopOpacity={0.3} />
<stop offset="95%" stopColor="#2563eb" stopOpacity={0} />
</linearGradient>
</defs>
<CartesianGrid strokeDasharray="3 3" stroke="#f1f5f9" />
<XAxis dataKey="date" stroke="#64748b" />
<YAxis stroke="#64748b" allowDecimals={false} />
<RechartsTooltip />
<Legend />
<Area
type="monotone"
dataKey="count"
name={trendType === 'create' ? '新增文档' : '浏览数'}
stroke="#2563eb"
fillOpacity={1}
fill="url(#colorCount)"
strokeWidth={3}
/>
</AreaChart>
</ResponsiveContainer>
) : (
<Empty description="暂无趋势数据" style={{ padding: '80px 0' }} />
)}
</Card>
</Col>
</Row>
{/* 分类分布 + 用户活跃排行 */}
<Row gutter={24} style={{ marginBottom: 24 }}>
<Col xs={24} lg={12}>
<Card
title={
<Space>
<PieChartOutlined style={{ color: '#2563eb' }} />
<Text strong>分类文档分布</Text>
</Space>
}
style={{
borderRadius: 12, border: '1px solid #e2e8f0',
boxShadow: '0 2px 8px rgba(0, 0, 0, 0.04)',
}}
>
{categoryDistribution.length > 0 ? (
<ResponsiveContainer width="100%" height={300}>
<PieChart>
<Pie
data={formatCategoryData(categoryDistribution)}
cx="50%" cy="50%"
labelLine={false}
label={({ name, percent }: any) =>
`${name} ${(percent * 100).toFixed(0)}%`}
outerRadius={100}
fill="#8884d8"
dataKey="value"
>
{formatCategoryData(categoryDistribution).map((entry: any, index: number) => (
<Cell key={`cell-${index}`} fill={entry.color} />
))}
</Pie>
<RechartsTooltip />
</PieChart>
</ResponsiveContainer>
) : (
<Empty description="暂无分类数据" style={{ padding: '60px 0' }} />
)}
</Card>
</Col>
<Col xs={24} lg={12}>
<Card
title={
<Space>
<BarChartOutlined style={{ color: '#2563eb' }} />
<Text strong>用户活跃排行</Text>
</Space>
}
extra={
<Tooltip title="导出活跃用户 CSV">
<Button
size="small"
icon={<DownloadOutlined />}
onClick={handleExportActiveUsers}
loading={exporting === 'users'}
>
导出CSV
</Button>
</Tooltip>
}
style={{
borderRadius: 12, border: '1px solid #e2e8f0',
boxShadow: '0 2px 8px rgba(0, 0, 0, 0.04)',
}}
>
{userActivity.length > 0 ? (
<ResponsiveContainer width="100%" height={300}>
<BarChart data={formatActivityData(userActivity)} layout="vertical">
<CartesianGrid strokeDasharray="3 3" stroke="#f1f5f9" />
<XAxis type="number" stroke="#64748b" allowDecimals={false} />
<YAxis type="category" dataKey="name" stroke="#64748b" width={80} />
<RechartsTooltip />
<Bar dataKey="score" name="活跃度评分" fill="#10b981" radius={[0, 4, 4, 0]} />
</BarChart>
</ResponsiveContainer>
) : (
<Empty description="暂无活跃度数据" style={{ padding: '60px 0' }} />
)}
</Card>
</Col>
</Row>
{/* 热门排行表格 */}
<Row gutter={24}>
<Col xs={24} lg={12}>
<Card
title={
<Space>
<TrophyOutlined style={{ color: '#2563eb' }} />
<Text strong>热门文档排行</Text>
<Badge
count={hotDocType === 'view' ? '浏览量' : hotDocType === 'like' ? '点赞数' : '收藏数'}
style={{ backgroundColor: '#8b5cf6' }}
/>
</Space>
}
extra={
<Tooltip title="导出热门文档 CSV (前50条)">
<Button
size="small"
icon={<DownloadOutlined />}
onClick={handleExportHotDocs}
loading={exporting === 'docs'}
>
导出CSV
</Button>
</Tooltip>
}
style={{
borderRadius: 12, border: '1px solid #e2e8f0',
boxShadow: '0 2px 8px rgba(0, 0, 0, 0.04)',
}}
>
{popularDocuments.length > 0 ? (
<Table
columns={docColumns}
dataSource={popularDocuments}
rowKey="documentId"
pagination={false}
size="middle"
style={{ fontSize: 14 }}
/>
) : (
<Empty description="暂无热门文档" style={{ padding: '40px 0' }} />
)}
</Card>
</Col>
<Col xs={24} lg={12}>
<Card
title={
<Space>
<UserOutlined style={{ color: '#2563eb' }} />
<Text strong>活跃用户排行</Text>
<Badge
count={activeUserType === 'create' ? '创建数' : activeUserType === 'comment' ? '评论数' : '浏览数'}
style={{ backgroundColor: '#10b981' }}
/>
</Space>
}
style={{
borderRadius: 12, border: '1px solid #e2e8f0',
boxShadow: '0 2px 8px rgba(0, 0, 0, 0.04)',
}}
>
{activeUsers.length > 0 ? (
<Table
columns={userColumns}
dataSource={activeUsers}
rowKey="userId"
pagination={false}
size="middle"
style={{ fontSize: 14 }}
/>
) : (
<Empty description="暂无活跃用户" style={{ padding: '40px 0' }} />
)}
</Card>
</Col>
</Row>
</div>
);
};
export default StatisticsPage;5.2 前端变更说明
| 变更点 | 修改前 | 修改后 |
|---|---|---|
| 时间选择 | 周/月/年 三个固定按钮 | Segmented 快捷选择 + RangePicker 日期范围选择器 |
| 趋势类型 | 固定显示「新增文档」 | Segmented 切换「新增文档」/「浏览趋势」 |
| 排行维度 | 固定浏览量排名 | Select 下拉选择 浏览量/点赞数/收藏数 |
| 用户排行维度 | 固定创建数排名 | Select 下拉选择 创建数/评论数/浏览数 |
| 数据导出 | 无 | 三个 导出CSV 按钮(趋势/文档/用户) |
| 缓存管理 | 无 | 清除缓存 按钮清除 Redis 并重新加载 |
| 自动刷新 | 无 | 自动刷新 按钮,每分钟轮询 |
| 错误处理 | catch 中静默吞掉 | Alert 组件展示错误信息,支持重试 |
| 空数据处理 | 无空状态处理 | Empty 组件在数据为空时展示提示 |
| 加载状态 | 全屏 Spin | Statistic 组件 loading 属性 + 骨架效果 |
| 类型安全 | any 类型 | 精确的 TypeScript 接口类型 |
| 重复代码 | getDateRange 在两处定义 | 统一从 statistics.service.ts 导入 |
测试
按顺序启动下面这些微服务:
kb-gateway
kb-statistic
启动前端
cd knowledge-base-frontend
npm run dev
浏览器访问数据分析页面:
http://localhost:3002/admin/statistics
总结
技术要点
- CSV 流式导出:直接写入
HttpServletResponse输出流,避免磁盘 I/O,支持大数据量导出 - BOM + 字段转义:确保 Excel 正确识别 UTF-8 编码,安全处理含特殊字符的字段
- 日期范围解耦:
RangePicker与预设按钮互不干扰,用户可自由组合 - 类型安全:TypeScript 接口与后端 VO 字段精确对应,编译期捕获字段不匹配
- 组件化筛选:
Segmented+Select+RangePicker组合构建灵活的数据筛选面板 - 状态覆盖:loading / error / empty 三种状态完整覆盖,用户体验完善
- 缓存管理:通过
CacheManager.clear()支持手动刷新缓存,配合@Cacheable注解自动化
